Rabbit Hole
The Dynamo and the Token
Why the payoff from AI spend feels so uncertain right now, and what the electricity buildout of the 1900s says about when it shows up.
People who work with me know I’m excited about AI, probably annoyingly so. But the same theme keeps coming up in conversations with clients and colleagues: someone cites a study or a story that gives them pause, lately the one about Uber burning through its entire 2026 AI budget in four months and capping what employees can spend.1 Underneath every version is the same question. The AI spend doesn’t seem to be slowing down, the adoption numbers look fine, so where’s the productivity?
It’s a fair question, and the stakes keep growing:
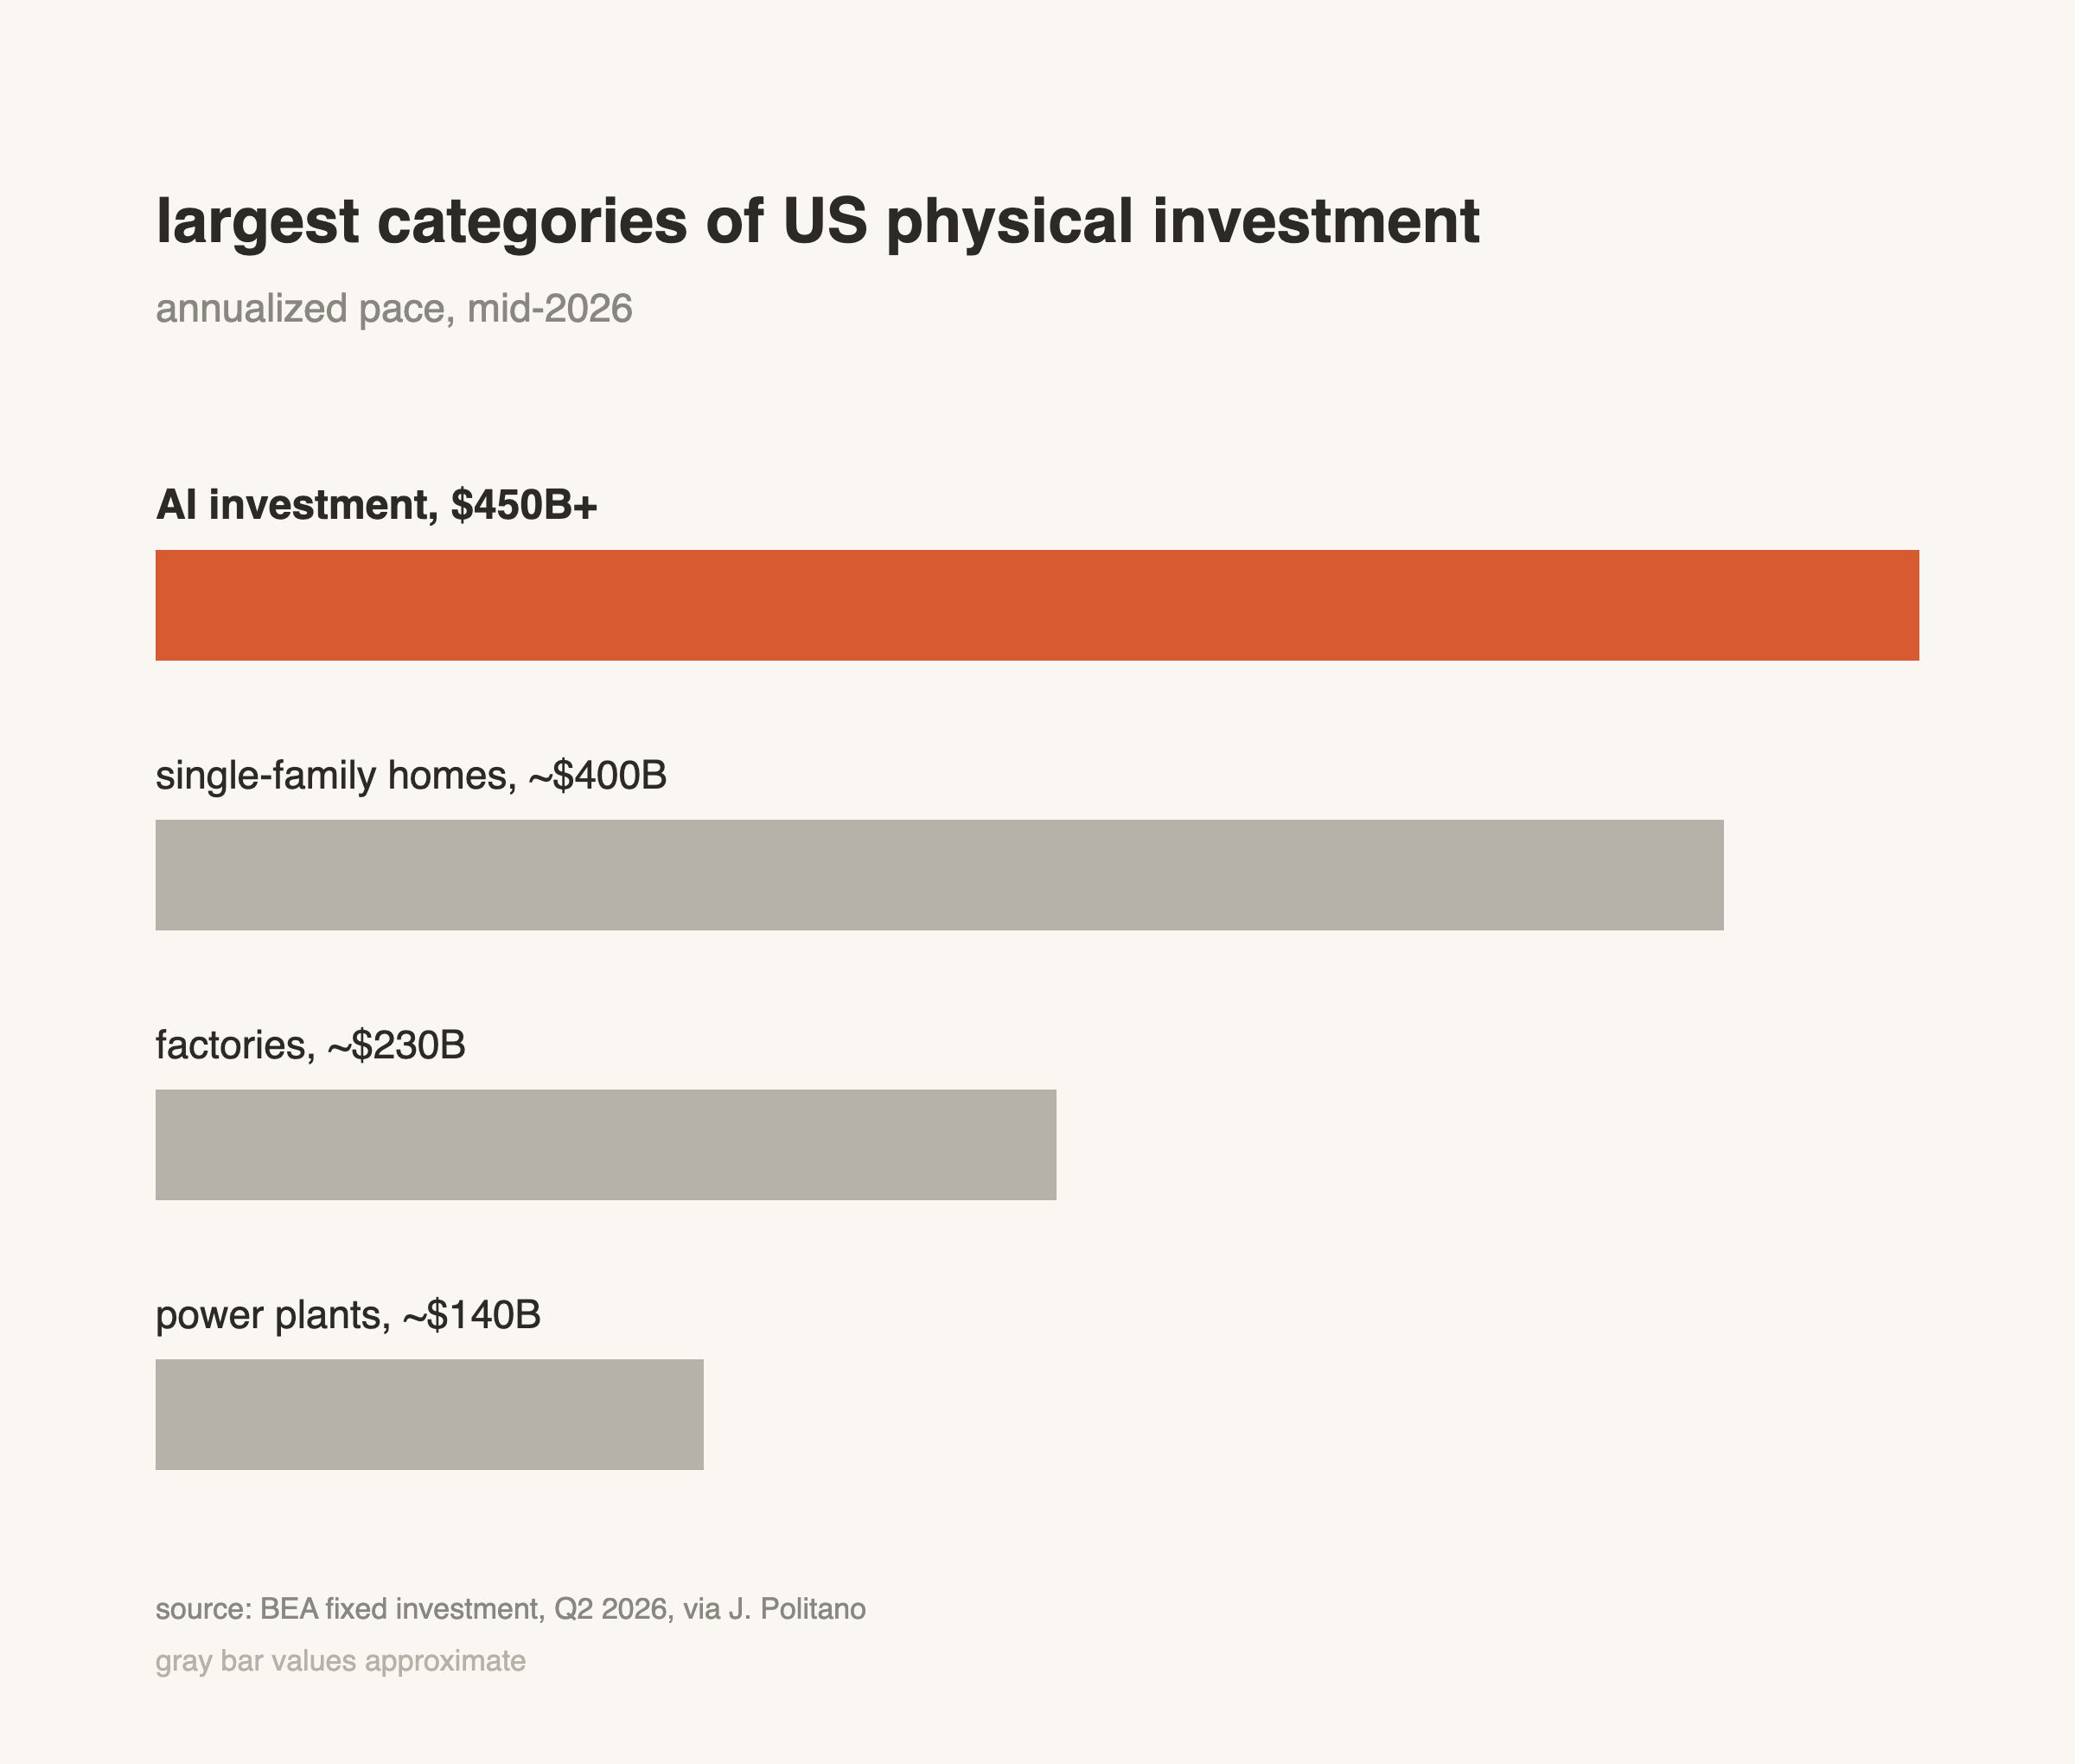
America now puts more capital into AI, north of $450 billion a year, than into building single-family homes. All of it underwritten by productivity gains that mostly haven’t arrived yet.
What sent me down this rabbit hole was a July episode of Prof G Markets. Noah Smith, talking through AI capex, casually mentioned that factories once ripped out their steam boilers, wired dynamos to the same old machinery, decided electricity was overrated, and put the boilers back. They had, in his words, “used an improper benchmark.” He moved on to his next point, but the example stuck with me: it’s the same question clients are asking now, just set a century earlier, and that version of it has an ending we can go look at. So I went digging into the history.
In 1900, electricity had been commercially available for two decades. Factories had it. Downtowns had it. You could find it almost everywhere except the productivity statistics. Robert Solow’s famous 1987 quip about computers, “you can see the computer age everywhere but in the productivity statistics,” was itself a rerun. In a 1990 essay called “The Dynamo and the Computer,” the economic historian Paul David pointed out that the dynamo had spent forty years in the same condition.2
Forty years. What took so long?
The factory the steam engine built
A nineteenth-century factory ran on one big engine. Steam turned a line shaft along the ceiling, and leather belts dropped down to every machine on the floor.
That one choice dictated everything else. Machines lined up under the shafts, in rows set by power access rather than the sequence of the work. Buildings went vertical because short shaft runs were efficient. The whole shaft turned even if a single lathe needed power. And a quarter of the energy died in the belts before it reached anything useful.3
Want to rearrange the floor? You were re-engineering the building’s power system. So almost nobody did.
Electricity’s first job was the lights
Here’s something that surprised me: factories actually adopted electricity fast. In the 1880s and 1890s, for lighting.
Electric light was safer than gas, ran cooler, and made night shifts feasible. Adoption was easy because the production process didn’t have to change. Electricity spent its first two decades in industry doing a peripheral job extremely well.
Hold that thought.
The expensive swap
Motorizing production came next, and the first version looked like the obvious move. Unbolt the steam engine, bolt a big electric motor in its place, keep everything else. The shafts, the belts, the layout, the workflow. Engineers called it group drive.
On paper it was terrible. Utilities were asking factory owners to scrap sunk capital in boilers and shafting, spend on wiring and motors, and then start paying a monthly power bill on top. The engineering studies of the day scored the swap on coal savings, because fuel was the visible line item, and on coal savings the case barely closed.4
So plenty of reasonable owners ran the numbers and passed, not because the technology failed them, but because the deployment model and the accounting both did.
The motor on every machine
The breakthrough came after 1900, when small cheap motors made unit drive possible: a motor on each machine.
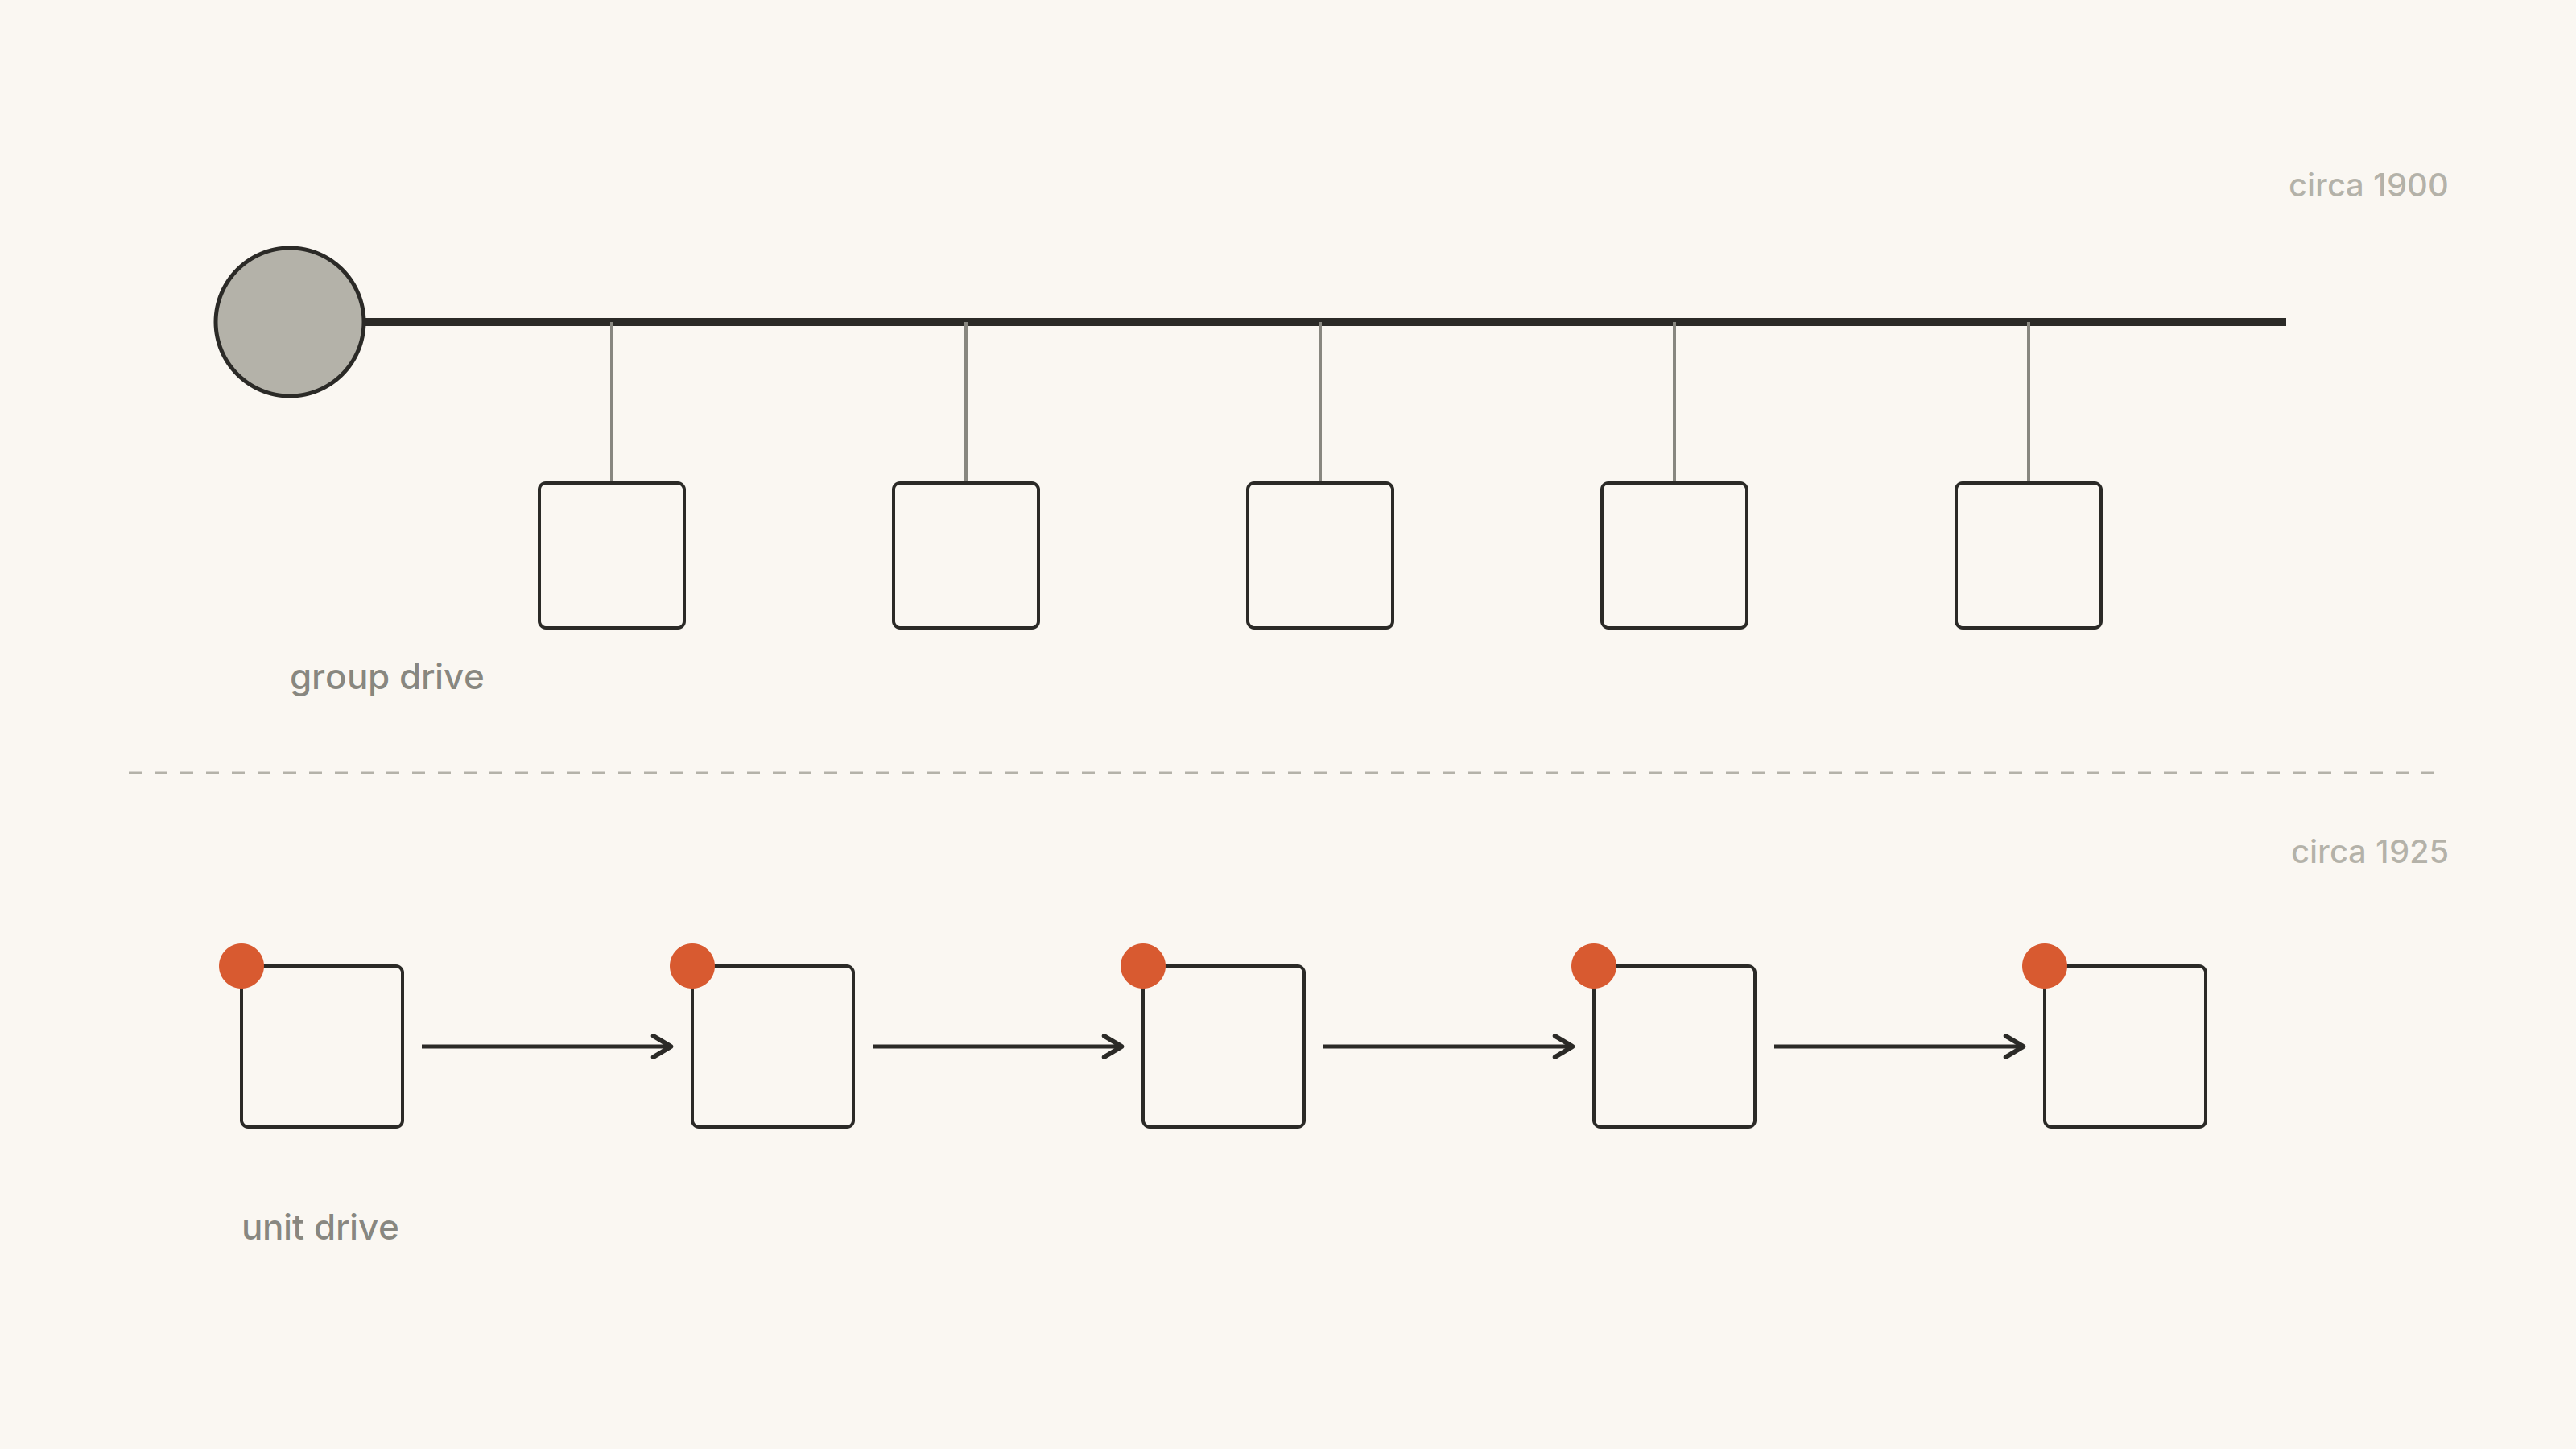
That sounds like a procurement detail, but it’s the hinge the whole story turns on.
Under steam, power came in one giant lump. Under unit drive, power was divisible. It arrived by wire wherever the work was, and it was metered at the machine, which turned out to be a big deal on its own. For the first time, an engineer could know what it cost to run one lathe for one hour. Operation-level cost accounting exists because of the electric meter.
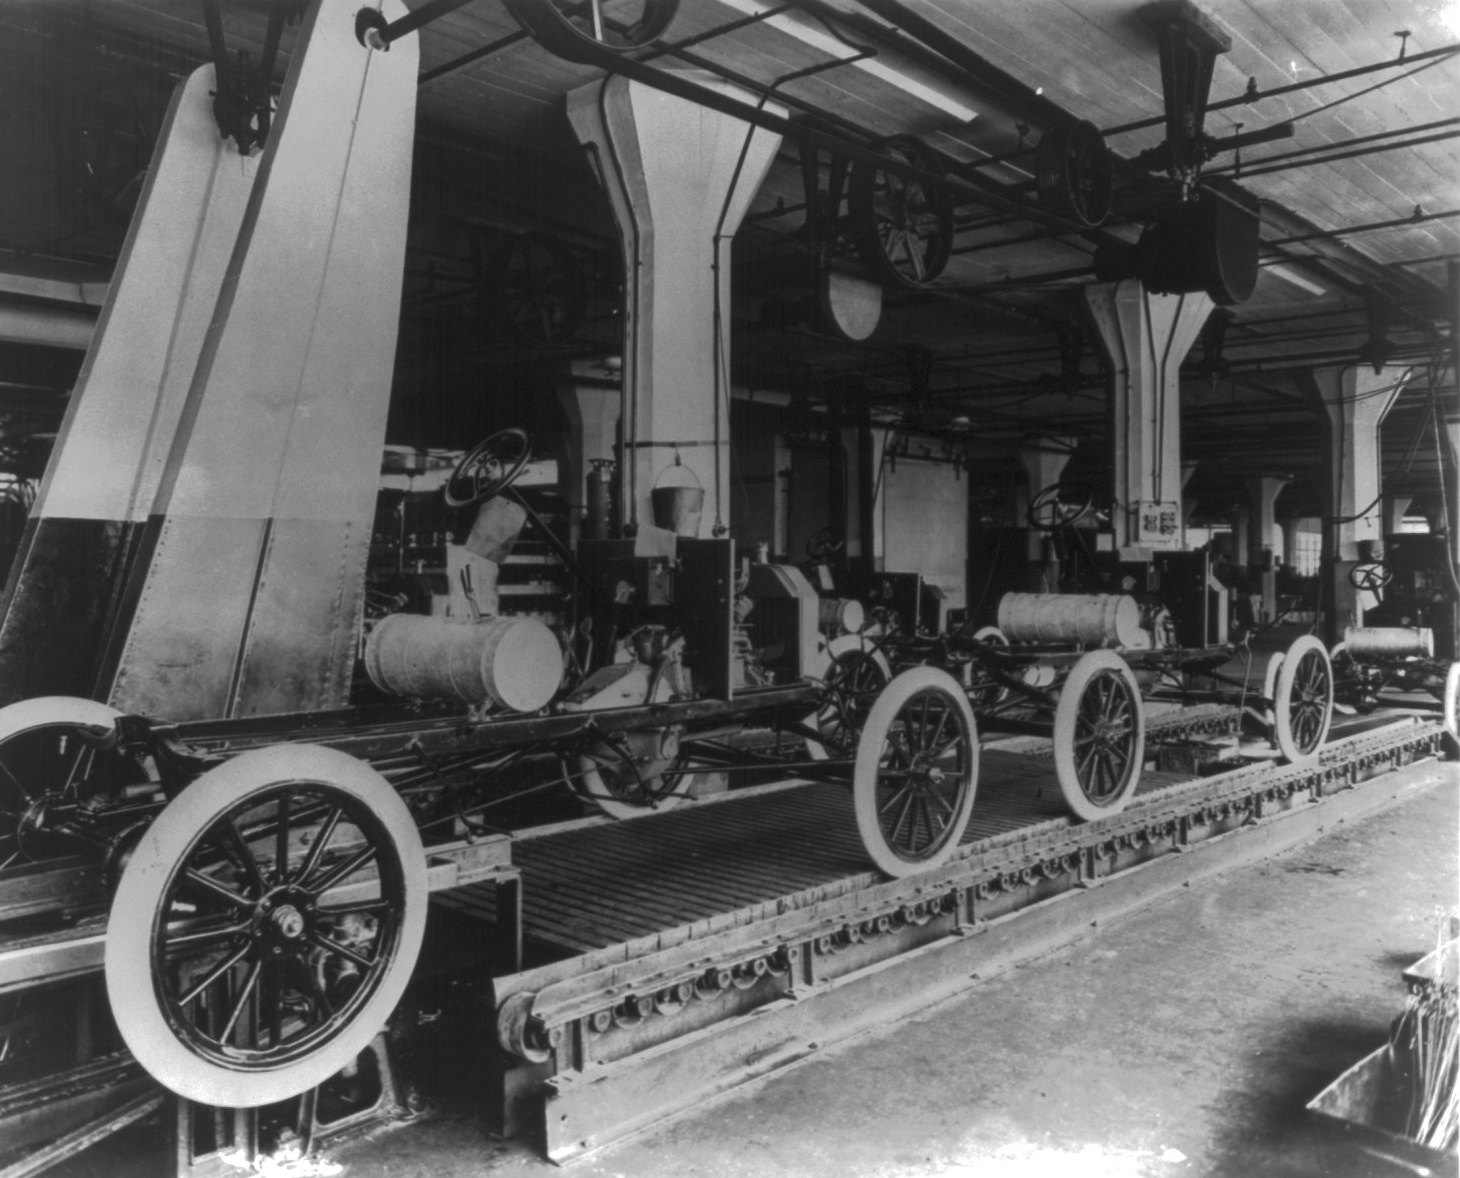
Once power stopped dictating architecture, the building changed. New factories went single story, filled with daylight, laid out along the flow of the work. Ford’s Highland Park plant is the famous case. The moving assembly line that debuted there in 1913 physically required electric drive; you can’t thread a moving chassis through a forest of overhead belts. Within a year, chassis assembly fell from over twelve hours to 93 minutes; over the next few years, the Model T’s price roughly halved.
The numbers finally move
Electricity was under 5 percent of factory horsepower in 1899, about half by 1919, and nearly four fifths by 1929.
Productivity followed the redesign, not the adoption. Output per hour grew 1.2 percent a year from 1899 to 1919, then 3.5 percent a year from 1919 to 1937. The same economy nearly tripled its rate of improvement using a technology it had owned for decades.5
The series that hits home is capital productivity, output per dollar of capital. It fell 1.8 percent a year for two decades, then swung to growing 3.1 percent a year:
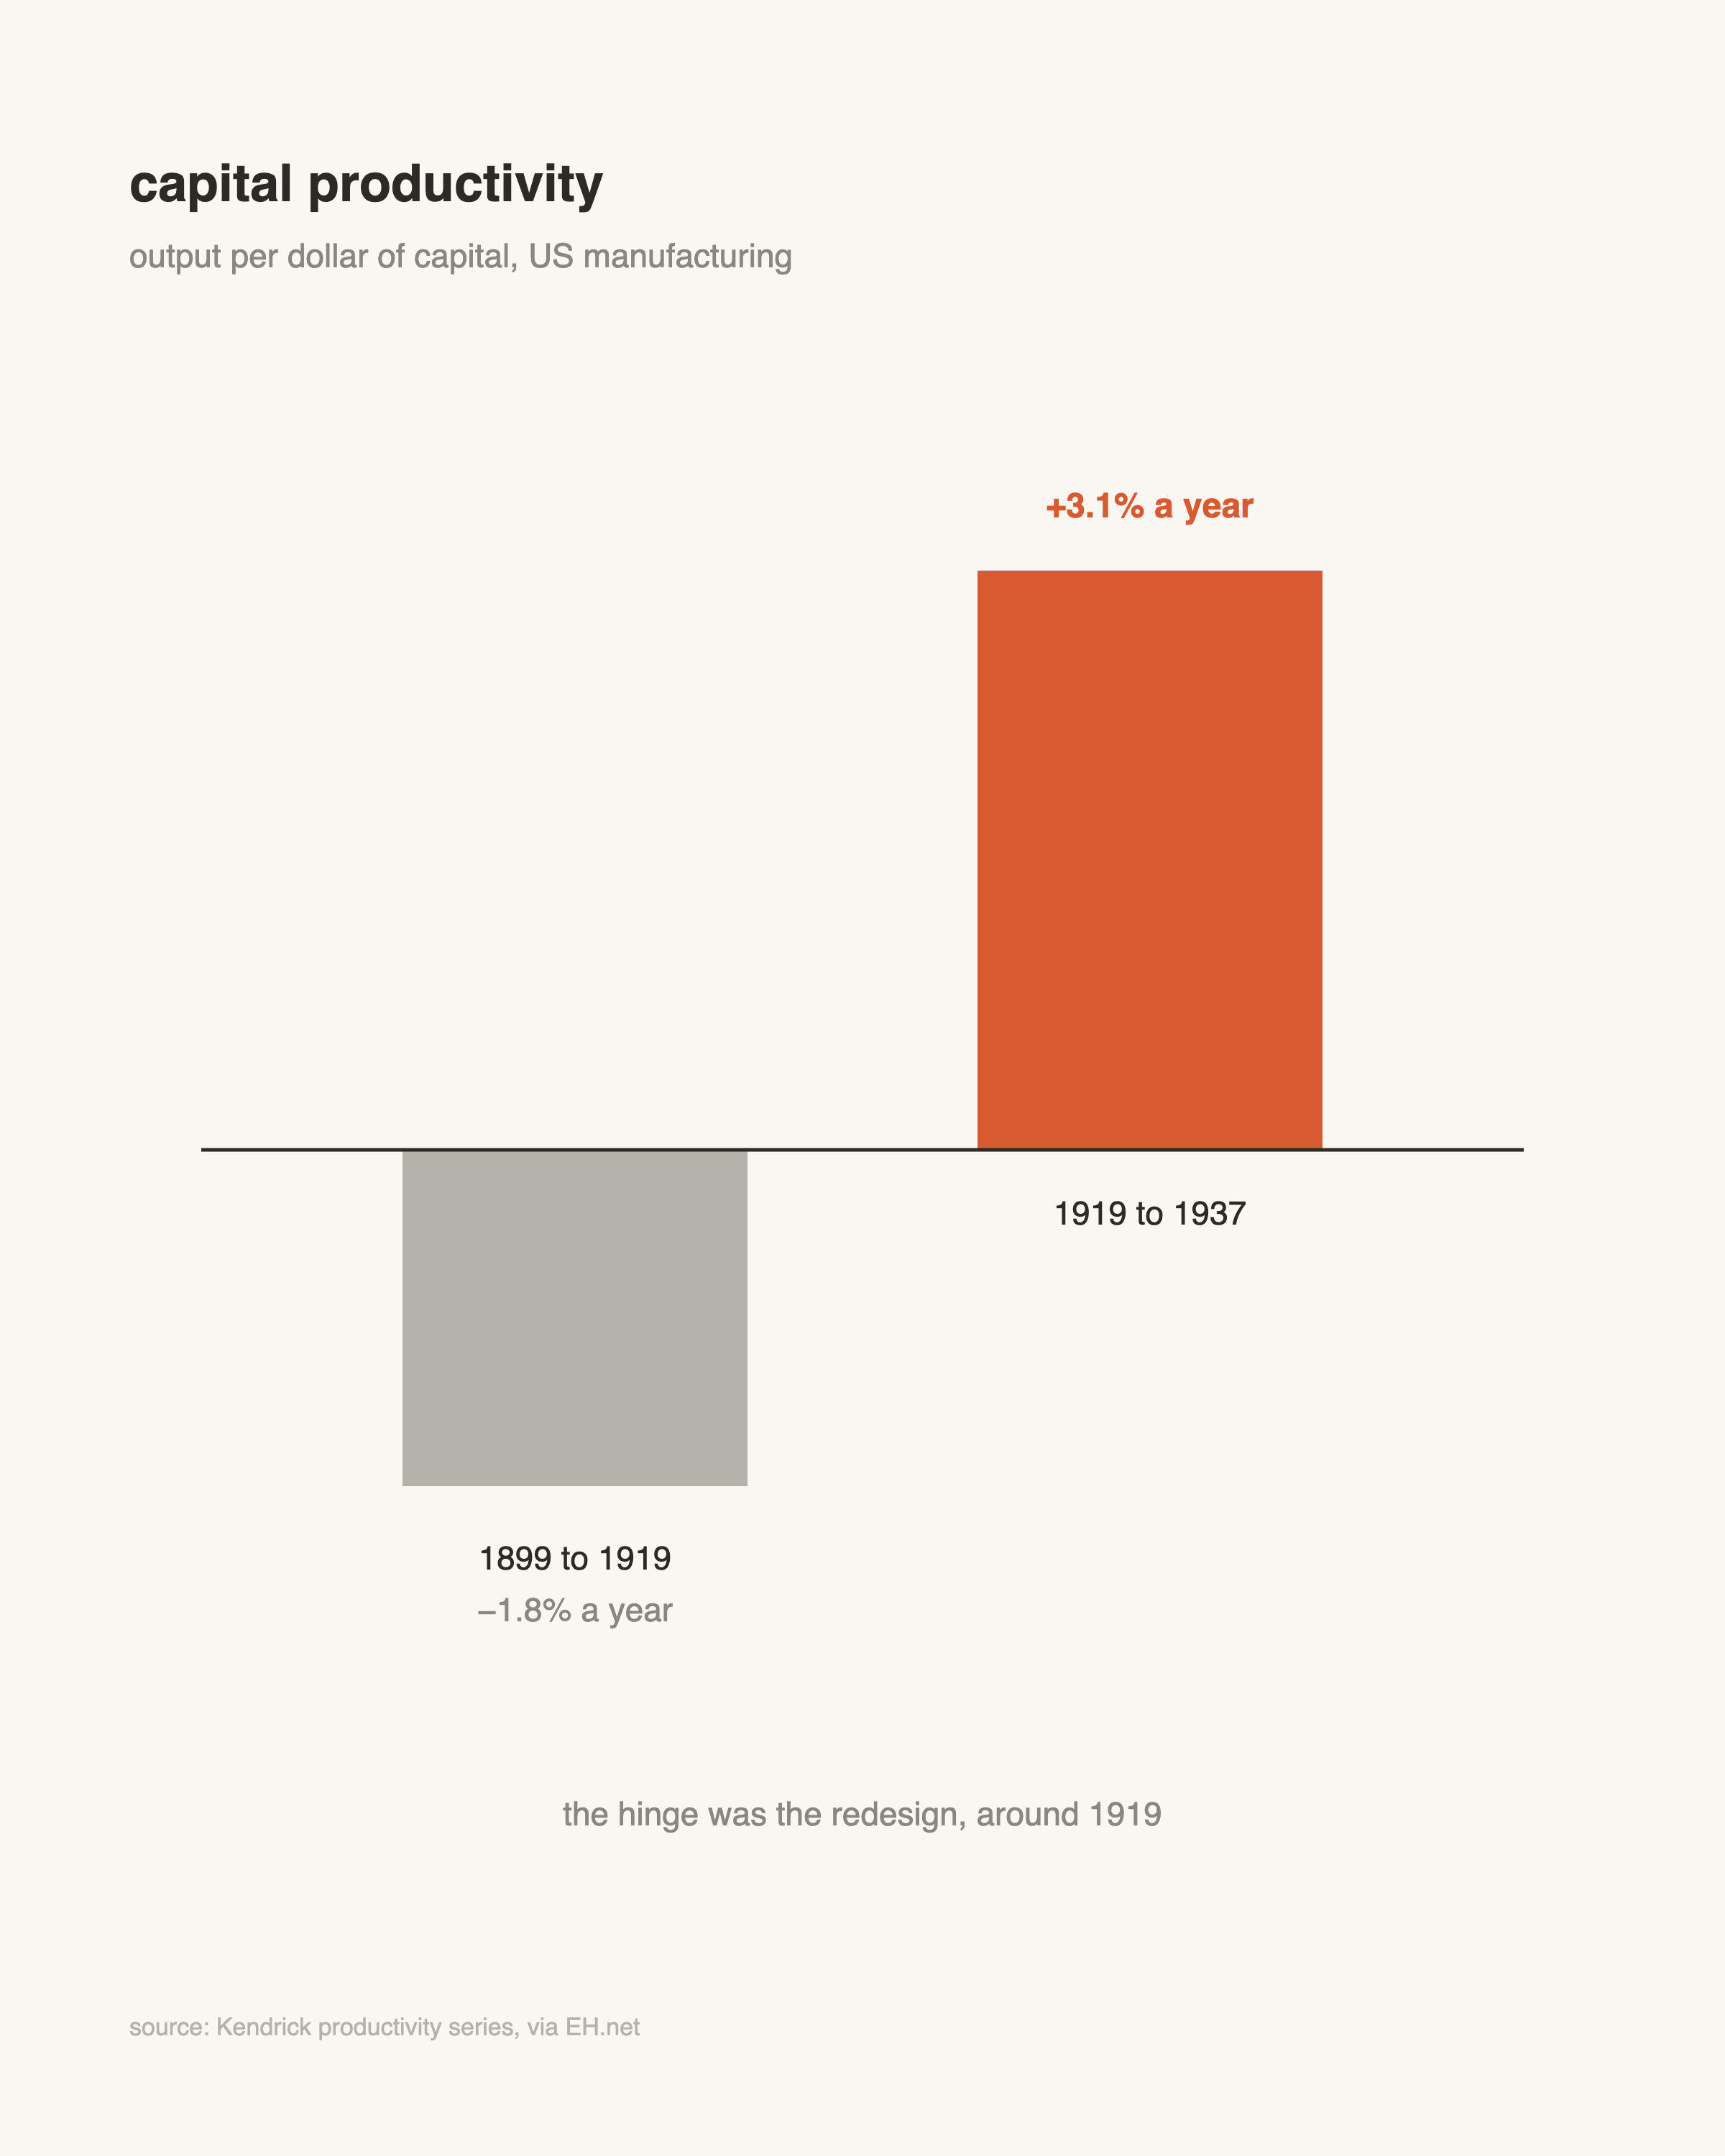
That reversal is most of the story. Two decades of adding capital, motors plus retained shafts plus redundant systems, with little to show for it. Then the old layers came out and the ratio turned. Researchers attribute roughly half of the 1920s productivity surge to electrification. I think, or at least hope, that’s the chart we’re living inside right now: deep in the falling stretch, hinge still ahead.
One more thing about David’s paper, because it’s the reason to take the analogy seriously. He wasn’t only explaining the past. Writing in 1990, with computers 25 years in and missing from the statistics, he used the electricity precedent to predict that the payoff was still coming. And it did: US productivity growth accelerated sharply from 1995 to 2004, driven largely by IT. The analogy has called one future correctly. Now we’re asking it to call a second.
Tokens are the new kilowatt-hours
Now run the tape forward. Jensen Huang describes data centers as AI factories: electricity in, tokens out, intelligence sold by the metered million. That’s the dynamo story in keynote language. A lumpy, centralized input became divisible, metered, and available at the point of work.
The unit economics are moving faster this time. GPT-4-class inference cost about $30 per million tokens in early 2023. Equivalent capability now runs under 50 cents.6
So bills went down, right? Not even close. When DeepSeek’s cheap model dropped, Satya Nadella summed it up: “Jevons paradox strikes again.” Global inference is up about 14x in a year, and the forecasts have it multiplying from here.7
Cheap electricity didn’t shrink power budgets either. It created aluminum smelting, an industry that needed the new price to exist. Cheap tokens are doing the same thing: reading every contract in the data room, monitoring every transaction, personalizing every renewal. Workloads that made no sense at the old price of cognition.
Group-drive AI
Now line that history up against a present-day scorecard: McKinsey surveys nearly two thousand leaders on this every year. In the latest read, almost nine in ten use AI somewhere, and more than eight in ten report no tangible impact on earnings from it.8 Self-reported and early, so treat it as directional.
Those surveys measure deployments, not capability. OpenAI’s GDPval benchmark puts real deliverables, legal briefs, engineering blueprints, care plans, in front of veteran professionals who grade the model’s version blind against a human expert’s. The models are approaching expert quality on a roughly straight line.9 The capability is showing up on schedule. The P&L impact isn’t.
That gap has a precedent, and the San Francisco Fed drew it earlier this year:
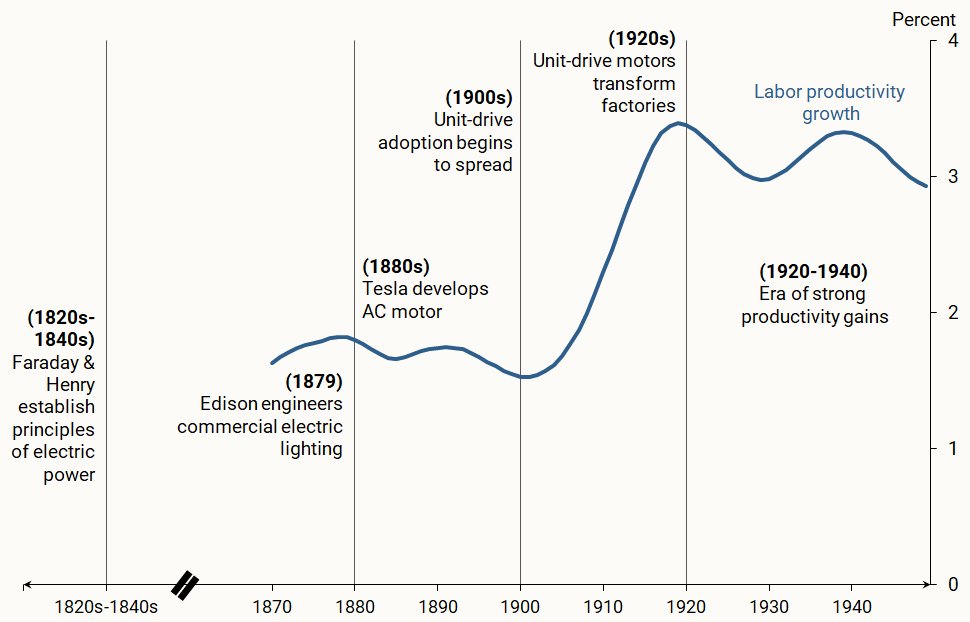
Look at how much electrical history sits on the flat part of that curve. Faraday’s principles, Edison’s lighting, Tesla’s AC motor, all of it. Productivity growth doesn’t leave its groove until unit drive spreads through factories, and then it roughly doubles. Survey electrification in 1902, twenty years after Edison’s first power station, and you’d have found broad experimentation and no measurable effect. Today’s numbers are a census of group drive, taken in year three.
The pattern matches all the way down. A copilot bolted onto a frozen workflow is a big motor on old shafting: one step gets faster, the system doesn’t. Our line shafts are just harder to see because they’re organizational. Approval queues. Weekly batch cycles. Handoffs between functions. Documents formatted for human eyes. Org charts sized to human throughput.
Most of that machinery exists because cognition used to come in person-sized lumps.
Meanwhile, Microsoft’s workplace surveys find three quarters of knowledge workers already using AI on the job, and nearly 80 percent of them bringing their own tools rather than waiting for an official rollout.10 The chat assistant is this era’s lighting phase; most people use it, and it helps, the way electric light helped: real value, delivered at the edge of a production process it doesn’t touch.
The constraint, now as then, is the building the technology is wired into, and ours happens to be made of workflows instead of brick.
What unit drive looks like now
So what’s the unit-drive version of an AI program, as opposed to the group-drive one almost everyone is running? Reading back through the record, the factories that eventually made money did four things the others didn’t, and each one translates directly.
Redesign a whole flow. Pick one end-to-end process and rebuild it assuming cognition is available at every step, the way unit drive assumed power at every machine. This is also what separates McKinsey’s high performers in the data: they redesign workflows instead of layering AI onto existing ones.8 History adds a hint on timing: factories converted when they were rebuilding anyway. The modern equivalents are re-platformings, integrations, and separations, the rare moments a process gets rebuilt regardless.
Change the KPI. Track two lines: total token spend, and cost per completed outcome.
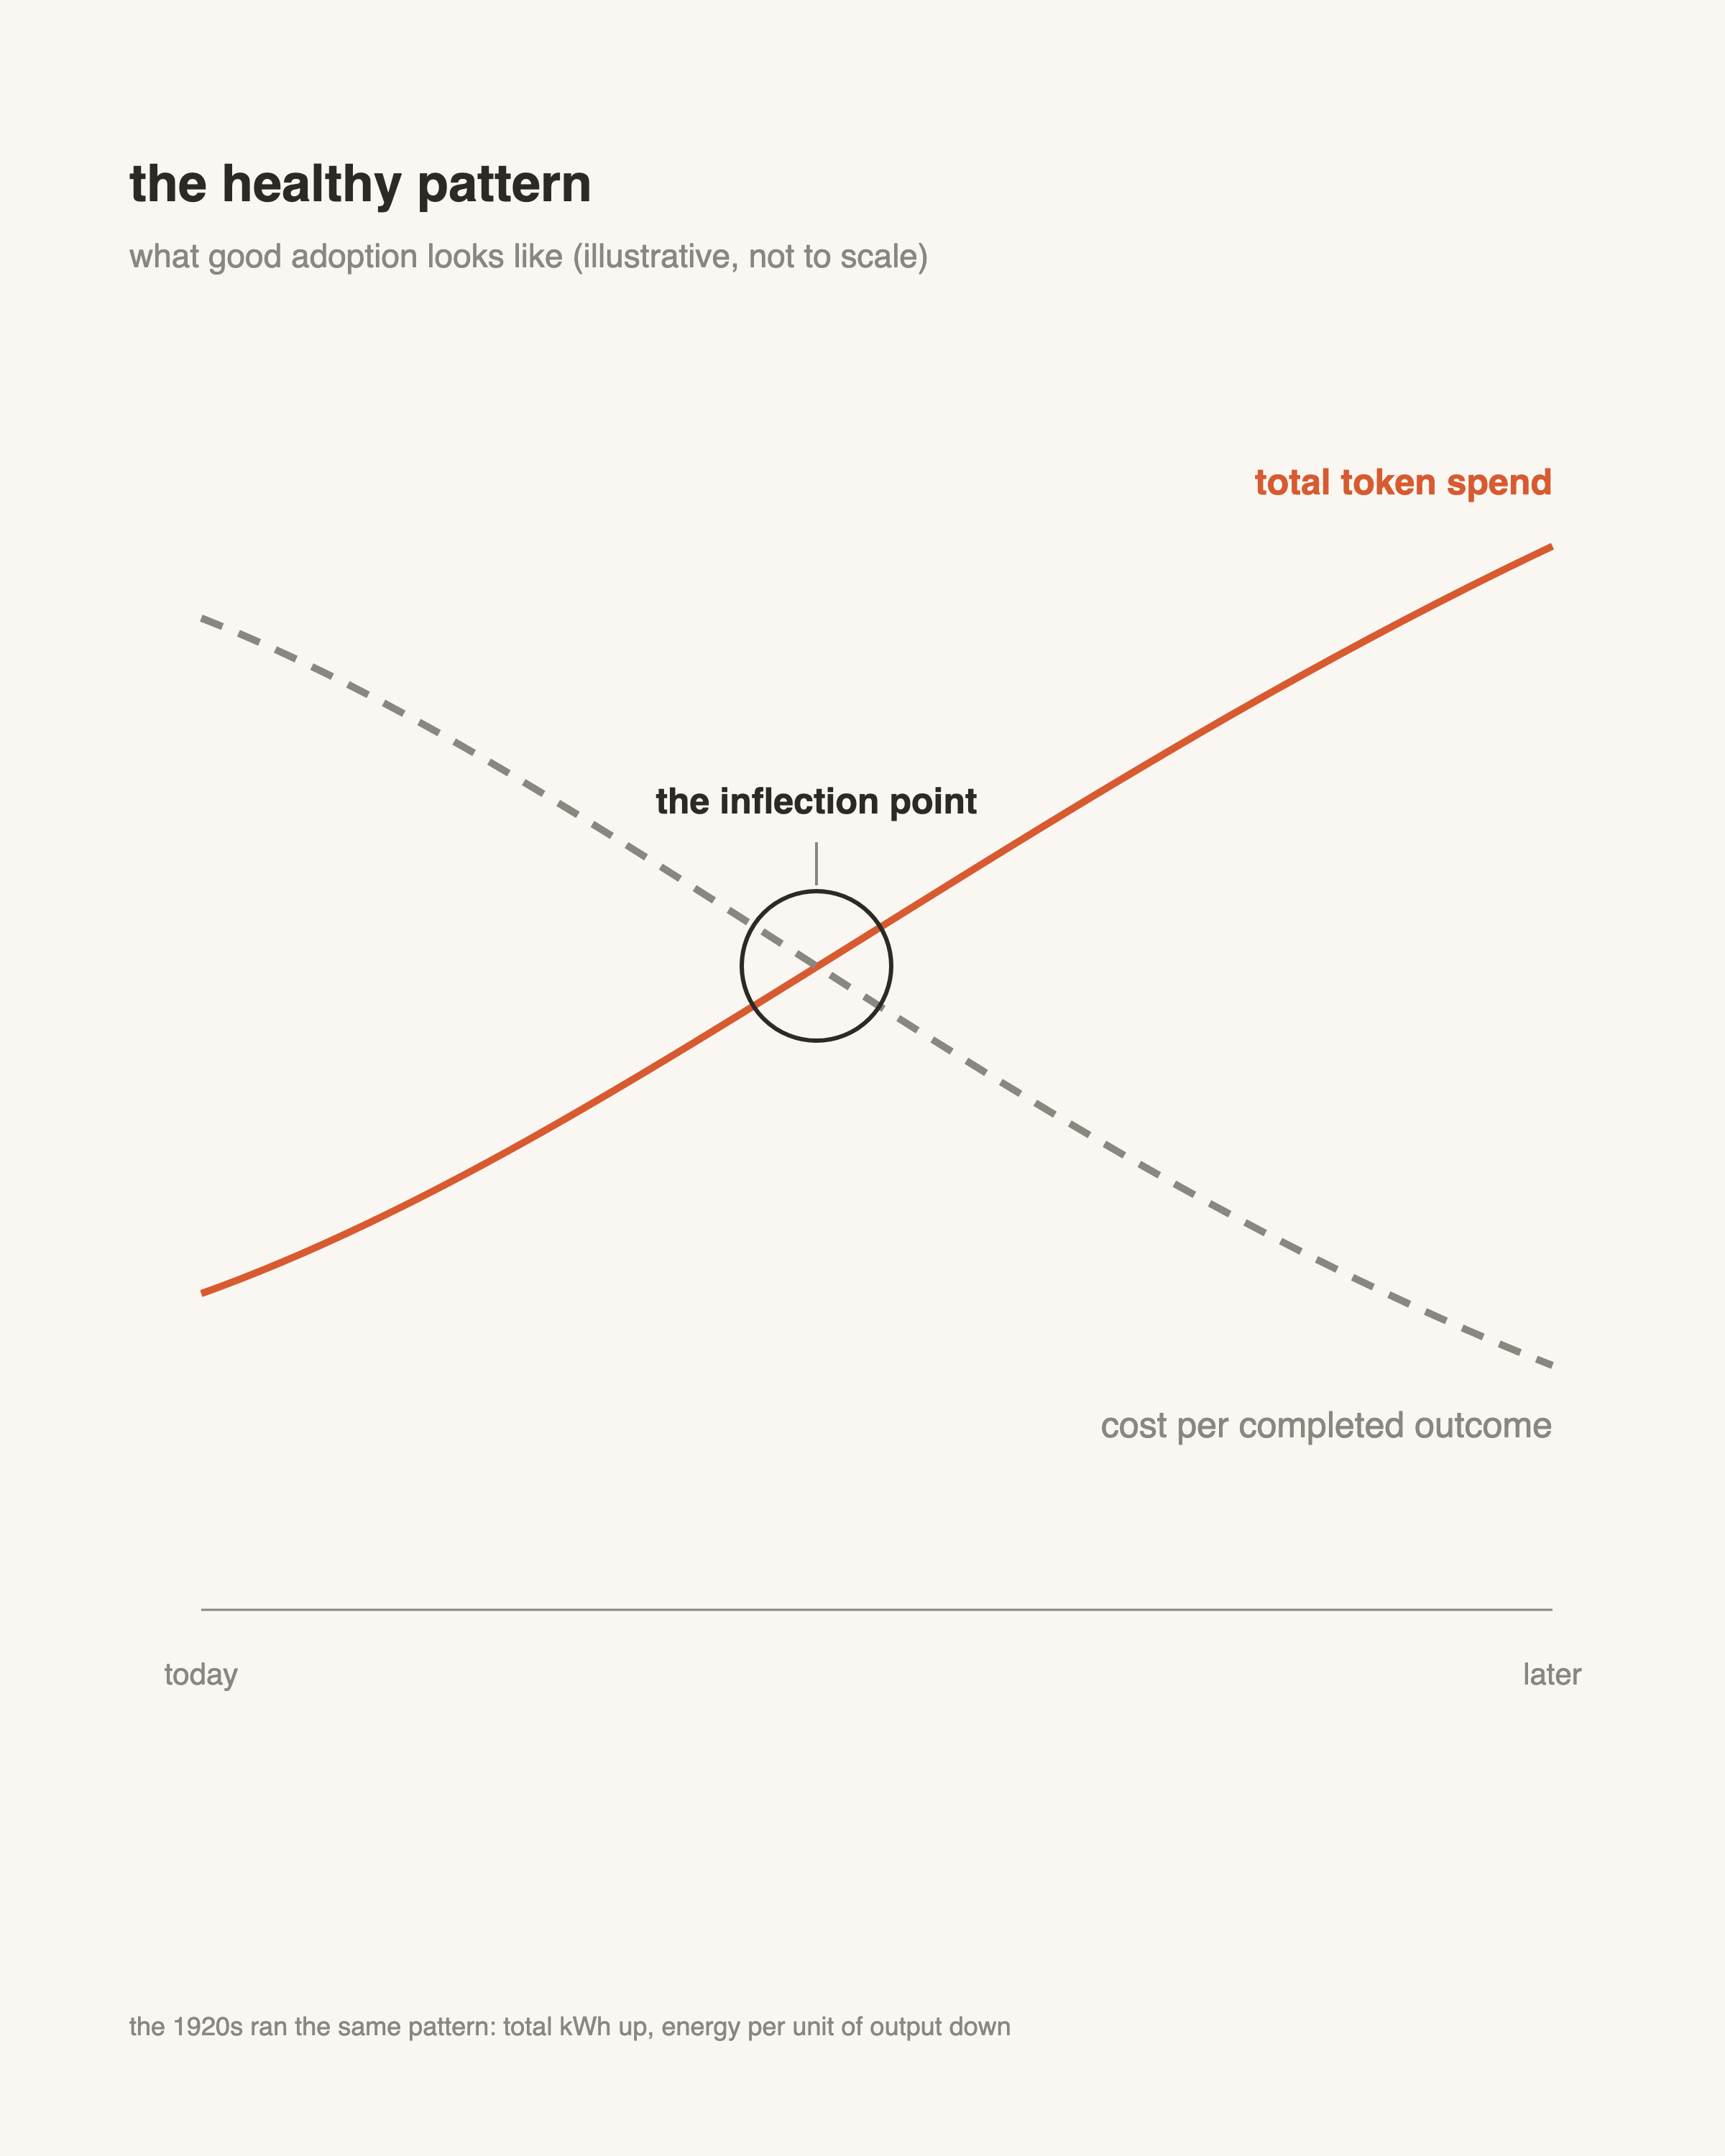
The first line is already getting attention. In EY’s latest AI pulse survey, 82 percent of leaders were concerned about token costs, and nearly all of them said those costs have them rethinking their approach.11 The trouble is that the first line can’t be read alone, because total spend rising is what success looks like too. Whether Uber’s four-month burn was waste or a bargain depends entirely on what those tokens finished, and the spend line has no way of saying.
The 1920s version of this chart had the same two lines moving the same two directions: total kilowatt-hours climbing while energy per unit of output fell. Measure the falling line in cost rather than tokens, though, because tokens per outcome is going up, and should be: reasoning models buy accuracy with tokens, and reasoning traffic went from a rounding error to more than half of all routed traffic in about a year.12 Cost per outcome falls anyway, because the price of capability drops faster than the token count climbs.
Build the cadre. Electrification waited on factory architects and plant engineers who understood the new logic, plus a decade of handbooks codifying the practice. Today’s equivalent is people fluent in both process design and model behavior, and of course they’re scarcer than GPUs.
Budget for the dip. Economists call it the productivity J-curve: general-purpose technologies demand heavy investment in process, skills, and business models, which shows up as cost long before it shows up as output.13 Capital productivity fell for twenty years before it flipped. The dip is the tuition.
Where the analogy breaks down
Two differences matter here.
A kilowatt-hour in 1930 was identical to a kilowatt-hour in 1910. The value of a token hasn’t stabilized yet. The longest task a frontier model can finish on its own, measured in the time it would take a person, was about two seconds’ worth in 2019. It’s about five hours now, and it has doubled roughly every seven months.14 The unit of cognition upgrades itself while you’re mid-redesign, which argues for designing around durable primitives like metered cognition and verification layers, rather than around any current model’s quirks.
And a motor either runs or it doesn’t, while a model’s output varies from run to run, which makes the human checkpoints and quality gates part of the redesign itself rather than overhead on it.
The forty-year lag probably doesn’t transfer either. The mechanisms behind it, sunk capital, slow diffusion of know-how, physical construction, are present but weaker. The reasonable bet is a lag that compresses without disappearing.
The factories that lost money on electricity bought motors and kept their buildings. The ones that made money understood the motor was really a license to rebuild, and that the productivity came from the rebuilding. The token spend is the motor, nothing more, and the returns are waiting in the building around it. That’s one of the two answers I give when people ask where the returns are. The other one came up earlier, with aluminum smelting: the work that only becomes worth doing once the price of cognition falls far enough. History’s encouraging note is that the rebuild eventually paid, and paid big. Its warning is that almost everyone waited twenty years to start.
Further reading
The history here is genuinely fun to read, and the modern data is better than the headlines about it. The good stuff:
- America’s Economy Is Entering a New Era — ft. Noah Smith — the Prof G Markets episode that sparked this post. Smith writes at Noahpinion.
- The Dynamo and the Computer — Paul David’s 1990 essay. Short, sharp, and the backbone of this post.
- From Shafts to Wires — Warren Devine’s 1983 paper, built from what the trade press was saying while the switch actually happened.
- The AI Moment? Possibilities, Productivity, and Policy — the San Francisco Fed letter the chart above comes from.
- The U.S. Economy in the 1920s — EH.net’s overview, source of several numbers here.
- The Productivity J-Curve — Brynjolfsson, Rock, and Syverson on why transformative technology reads as cost before it reads as output.
- METR’s time horizons — the doubling chart for how long a task AI can finish on its own.
- GDPval — OpenAI’s benchmark of real work products, graded blind against human experts.
- The State of AI — McKinsey’s annual survey of who’s getting value and who isn’t.
- AI Pulse Survey — EY’s quarterly read on the C-suite, including the token-cost numbers.
- LLMflation — a16z on inference prices falling roughly 10x a year.
- State of AI: 100 Trillion Tokens — OpenRouter’s empirical study of what people actually run.
Notes
- Widely reported in May 2026: Uber exhausted its 2026 AI budget in roughly four months as AI coding tools spread across some 5,000 engineers, then moved to monthly per-employee token caps. Fortune, May 26, 2026. ↩
- Paul David, “The Dynamo and the Computer” (American Economic Review, 1990). The essay this post leans on. ↩
- Transmission losses through shafting and belts typically ran 25 percent or more; Baldwin Locomotive Works figured its shafts and millwork ate about 40 percent more floor space than electric drive eventually would. Warren Devine, “From Shafts to Wires” (Journal of Economic History, 1983). ↩
- Harold Platt, The Electric City, on the utilities’ sales problem. Devine (1983) on the coal-savings accounting. ↩
- Horsepower shares: census series via the Smithsonian and EH.net. Productivity series: Kendrick, via EH.net. Roughly half of 1920s manufacturing productivity growth attributed to electrification: David and Wright (Oxford, 1999). A study of North Carolina factories from 1905 to 1926 found electrified plants pulling ahead of non-adopters on output and wages: Will Damron, Explorations in Economic History. ↩
- Stanford HAI AI Index on inference costs. Andreessen Horowitz’s “LLMflation” clocked GPT-3-level output falling roughly 1,000x in three years. ↩
- Global inference passed an estimated 30 quadrillion tokens a month in early 2026, per Exponential View. Goldman Sachs projects roughly 24x more by 2030. Gartner pegs agentic workloads at 5 to 30 times the tokens per task of a simple chat exchange. ↩
- McKinsey, “The State of AI” global survey (2025): 88 percent of nearly 2,000 respondents use AI in at least one function; more than 80 percent report no tangible enterprise-level EBIT impact from gen AI; roughly 6 percent qualify as high performers, distinguished mainly by workflow redesign. ↩
- OpenAI, “GDPval” (2025): 1,320 real work products across 44 occupations, graded blind by professionals averaging 14 years of experience. Frontier performance improving roughly linearly across model generations. ↩
- Microsoft and LinkedIn, Work Trend Index (2024): 75 percent of knowledge workers use AI at work; 78 percent of AI users bring their own tools. ↩
- EY US AI Pulse Survey, fifth wave (fielded April to May 2026, 534 senior leaders): 82 percent of leaders investing in AI are concerned about token usage and costs; 98 percent of those using token-based tools say costs have made them reconsider their approach; only about two thirds monitor usage against real budget guardrails. Disclosure: I’m a partner at EY. The same wave also has 98 percent reporting positive ROI on AI overall; the two numbers measure different things, an initiative paying back versus enterprise earnings moving, which is why the scorecard above uses McKinsey’s EBIT question. ↩
- OpenRouter and Andreessen Horowitz, “State of AI: An Empirical 100 Trillion Token Study” (2025). ↩
- Brynjolfsson, Rock, and Syverson, “The Productivity J-Curve” (2020). ↩
- METR’s task-completion time horizon: the longest task, in human expert time, that a model finishes with 50 percent reliability. Two seconds was GPT-2 in 2019; about five hours is the frontier in early 2026, with the doubling pace running faster since 2023. “Measuring AI Ability to Complete Long Tasks” (2025; Time Horizon 1.1 update, 2026). ↩
These are my personal observations, they don’t necessarily reflect the views of my firm. That said, we have some great AI tools and solutions, and I’d love to tell you about them.